Shop
Hardware
Software
Service
Case Studies
Contact
Sign in
John Doe
My account
Logout
German
en
Shop
Contact
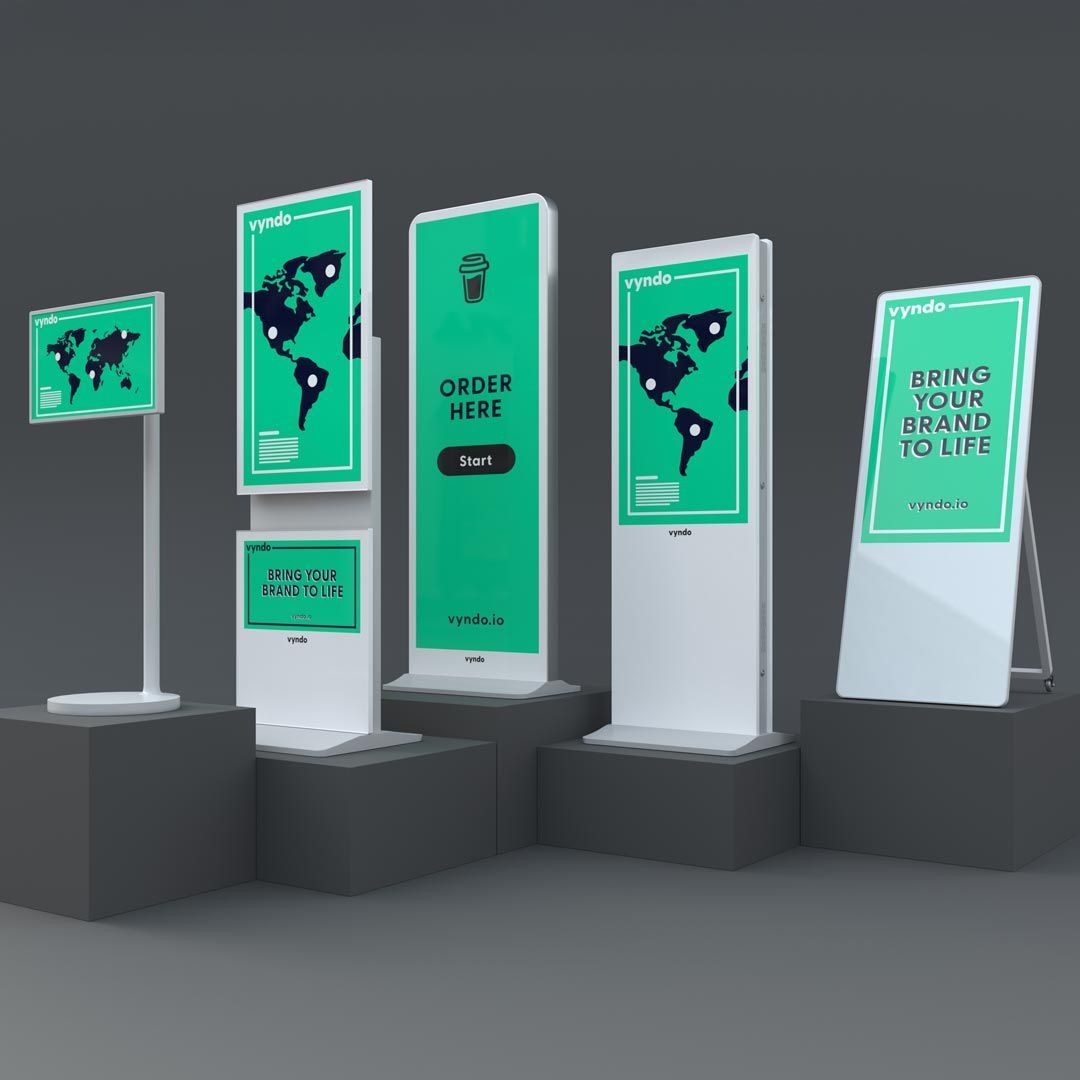
Digital Signage Advertising Stele Rent Buy
Info point for rent for sale
Digital Signage POS Marketing
Shop window marketing
Digital signage trade fair marketing
Infoterminal Kiosk System Rent Buy
Legal
GTC
Imprint
Privacy Policy
Data protection
Case Studies
Software
Login
John Doe
My account
Logout
Best Seller
Button
Hardware
Button
Software
Button
Service
Button
Show more
Contact us
555-555-5555
meinemail@mailservice.com
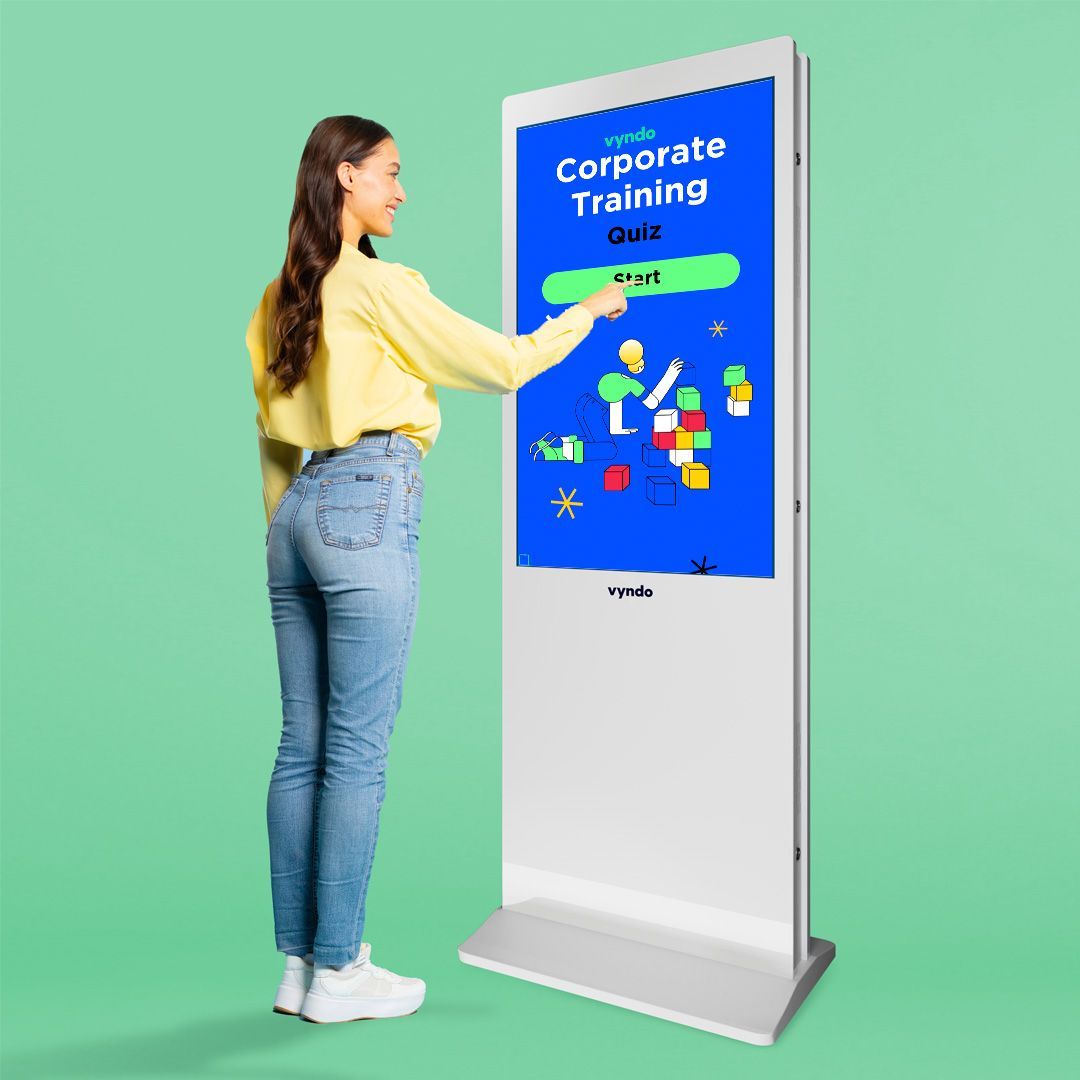
Interactive diagrams
Interactive charts transform your data into dynamic visualizations that can be operated by touch. Whether it's bar charts, line charts or pie charts, users can interact directly, explore data points and retrieve specific information.